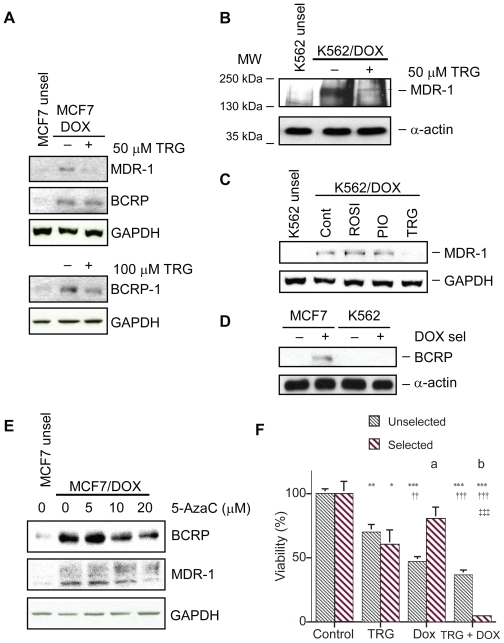
Figure 1.
Troglitazone (TRG) and 5-azacytidine (5-AzaC) downregulate MDR-1 and BCRP expression levels in doxorubicin (DOX)-resistant MCF7 breast cancer cells. A) Representative Western blots analyzing MDR-1 and BCRP protein levels in lysates (100 μg/lane for MDR-1 and 60 μg/lane for BCRP) of unselected and DOX-selected MCF7 cells. MCF7/DOX cells were treated with 50 or 100 μM TRG for 48 h prior to harvest. For determining the equivalency of the protein load the same Western blot membrane was stripped and reprobed with a GAPDH antibody. B) Parental K562 leukemia cells and K562 cells selected for DOX resistance were treated with 50 μM TRG for 48 h. Protein lysates were examined for MDR-1 protein expression using Western blotting. Antibodies against α-actin were used to determine equivalency of protein load. C) K562/DOX cells were treated with 50 μM ROSI, PIO, or TRG for 48 h prior to cell harvest and protein lysate preparation. Unselected K562 cells and K562/DOX cells treated with the drug vehicle DMSO were used as controls. Lysates were analyzed with antibody against MDR-1 or α-actin as a protein load control. D) Protein lysates prepared from selected and unselected MCF7 and K562 cells were examined for BCRP expression using antibodies against BCRP. E) Parental MCF7 cells and MCF7/DOX cells were treated with the 5-AzaC concentrations shown for 48 h. Protein lysates were examined for MDR-1 and BCRP expression using Western blot analyses. Antibodies against GAPDH served as protein load controls. F) Graph depicting how TRG (50 μM) and DOX (1 μM) alone or in combination affect the viability of unselected (n = 5/group) and DOX-selected (n = 10/group) MCF7 cells. Statistical analyses were done on the different treatments within a group using an ANOVA with a post-hoc Tukey–Kramer multiple comparison tests. Asterisks indicate significant differences (*P < 0.05; **P < 0.01; ***P < 0.001) from the respective control cells. Daggers indicate significant differences (††P < 0.01; †††P < 0.001) from the respective TRG-treated cells. Double daggers indicate significant differences (‡‡‡P < 0.001) from the respective DOX-treated cells. Statistical analyses between the same treatment groups in the unselected and selected cells were done using a nonparametric two-tailed Mann–Whitney test. There is a significant difference in response of unselected cells to DOX compared to selected cells (a. P = 0.008) and in response of unselected cells to DOX plus TRG compared to selected cells (b. P = 0.0007).
Abbreviations: BCRP, breast cancer resistance protein; GAPDH, glyceraldehyde-3-phosphate dehydrogenase; MDR, multiple drug resistance; MDR-1, multiple drug resistance protein 1.

