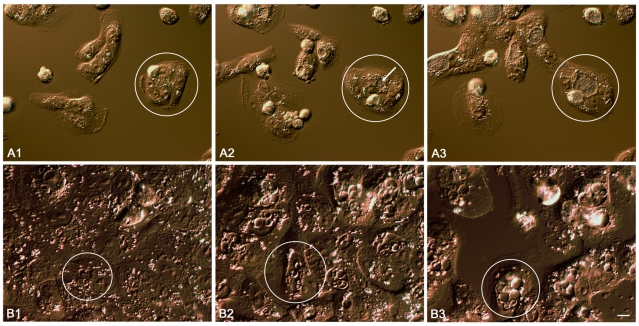
Figure 2. Interference contrast time lapse images of the C.trachomatis developmental cycle (A) and in the presence of penicillin (B).
A cell carrying an inclusion is circled in successive frames for each set of panels A1 to A3 and B1 to B3 which individually represent an image taken at the 6, 18 and 30 hrs post infection. The location of a normal inclusion soon after its first appearance is arrowed in panel A2 (18 hrs p.i.). This figure should be viewed in conjunction with the supporting video S1 (panels A1 - 3) and S2 (panels B1 - 3). The scale bar represents 4 µm.

