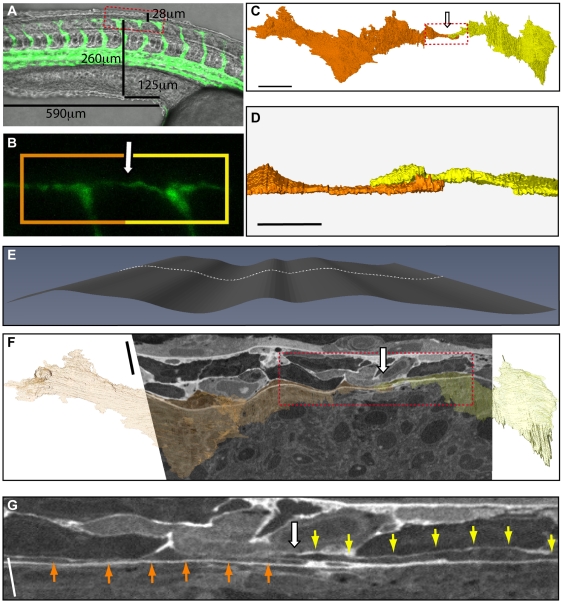
Figure 4. Anastomosis of the dorsal lateral anastomotic vessel.
(A) Still from live confocal imaging of a 28 hpf Tg(fli1: EGFP)y1 transgenic zebrafish at the point of anastomosis of filopodia from adjacent ISVs, overlaid on a phase image of the zebrafish. Measurements of the AOI are made in relation to gross physical markers like the yolk sac and yolk tube. (B) High magnification image of boxed area in (A) showing the point of anastomosis (arrow) and indicating vessels reconstructed in (C), (D) and (F) (orange and yellow box). (C, D) Features within the FIB/SEM dataset were segmented using Amira (Visage Imaging Inc.). Endothelial cells from adjacent ISVs (orange and yellow) form a thin layer between the neural tube and the somites. At the point of anastomosis filopodia from each cell overlap and contact (arrow). (E) It is only possible to visualise the ECs in the raw data by creating a curving plane through the volume using software (CurvedSlice, Amira). (F) Overview of the CurvedSlice data with the 3D reconstruction overlaid to highlight the filopodia of the ECs which narrow to <500 nm in places. When viewed in two dimensions the CurvedSlice distorts the data but captures the entire filopodia in one section demonstrating continuity. (G) High magnification of the AOI (box in (F)) from the CurvedSlice. Bar (C) 10 µm, (D) 3 µm, (F) 5 µm unidirectional, (G) 2.5 µm unidirectional.

