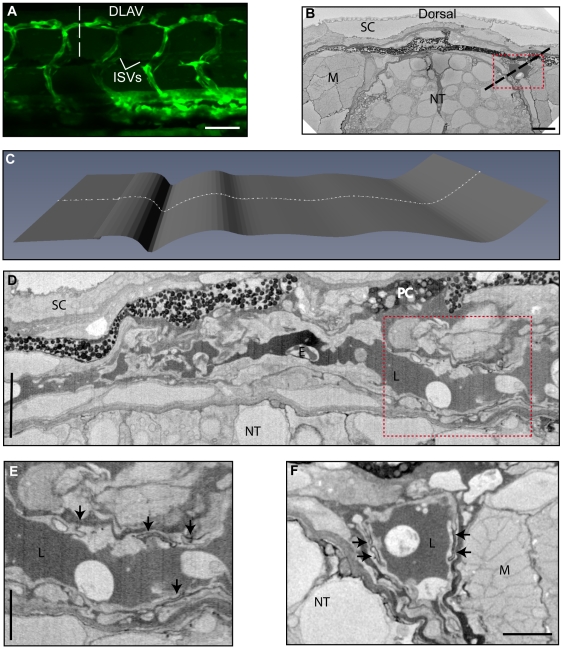
Figure 5. Ultrastructure of the formed dorsal lateral anastomotic vessel.
(A) Confocal projecion of 72 hpf Tg(fli1: EGFP)y1 transgenic zebrafish showing the fully formed DLAV. (B) Transverse section through 3View SBF/SEM dataset showing both DLAVs (dashed line in (A)). Scales (SC), muscle blocks (M), neural tube (NT). (C) Profile of the CurvedSlice (Amira) through the volume which selects one of the DLAVs (dashed line in (C)). (D) Overview of the CurvedSlice data showing the lumenized DLAV. Lumen (L), erythrocyte (E). (E) Higher resolution image of the DLAV from the boxed area in (D) showing electron dense patches between ECs which may represent cell-cell junctions (arrows). (F) Transverse section through the DLAV. Bar (A) 50 µm, (B) 5 µm, (D) 5 µm unidirectional, (E) 2.5 µm unidirectional, (F) 2.5 µm.

