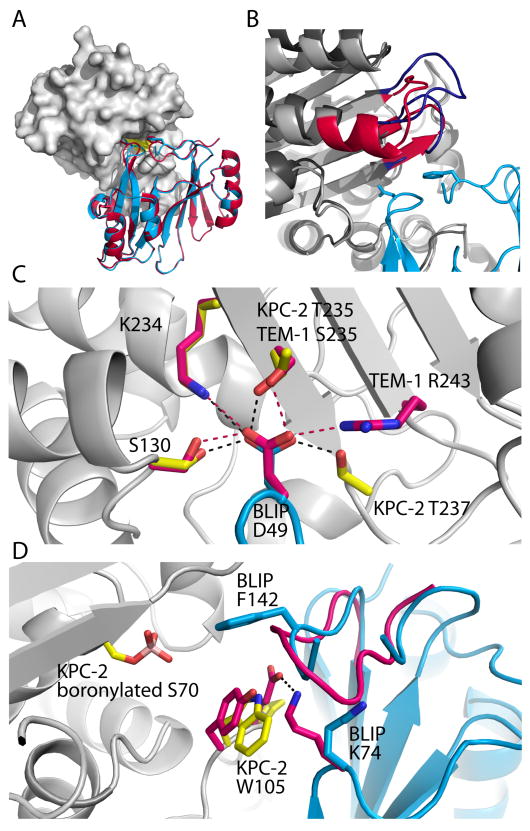
Figure 2.
Architecture of the KPC-2/BLIP interface. A) BLIP interacts with KPC-2 (gray) similar to its interaction with TEM-1; BLIP D49 and F142 loops occupy the active site (yellow). BLIP from the TEM-1 co-structure (red - PDB ID 1JTG) is aligned with BLIP in the KPC-2/BLIP structure (cyan - PDB ID 3E2L). B) KPC-2 contains a few extra residues that lose solvent accessible surface area upon binding BLIP, compared to TEM-1. KPC-2 residues 266–276 form an extended loop (blue), whereas the comparable TEM-1 residues (red) continue in an α-helix. C) The hydrogen bonds (black dashes) formed by BLIP D49 (cyan) to KPC-2 sidechains (yellow) and the corresponding hydrogen bonds (red dashes) and participants in the TEM-1/BLIP complex (bright pink). D) The inhibitor proteins are aligned from the KPC-2/BLIP (cyan) and TEM-1/BLIP (bright pink) co-structures. Inspection of the KPC-2 sidechains (yellow) and BLIP (cyan) compared to the TEM-1/BLIP conformers (bright pink) shows that in the TEM-1 interface, BLIP K74 participates in a salt bridge (black dash) across the interface with TEM-1 E104, which is lacking in the KPC-2/BLIP interface. The boronylated S70 is also shown.

