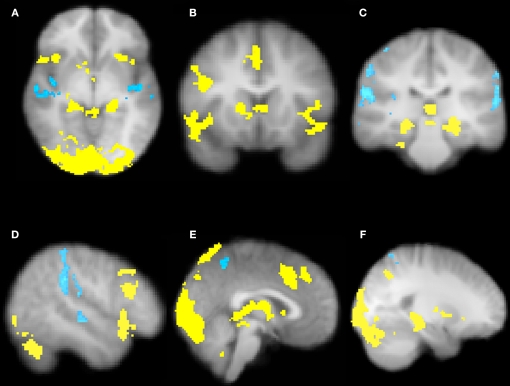
Figure 3.
Brain regions associated with expectation violation. These results are a linear contrast of standardized expectation error (SEE) when participants are viewing pictures of their partners during the memory task. Yellow values are associated with partners that offered more than the participant's initial expectation. Blue values are associated with viewing partners that offered less than the participant's initial expectation. (A) Axial section shows bilateral insula, ventral striatum, bilateral posterior hippocampi, visual cortex associated with positive SEE, while right superior temporal sulcus and bilateral posterior insula are associated with negative SEE. (B) Coronal section shows bilateral anterior insula, ventral striatum, right dorsolateral prefrontal cortex, and pre-supplementary motor area/dorsal anterior cingulate. (C) Coronal section shows bilateral posterior hippocampus. (D) Right lateral section shows DLPFC, VLPFC, and TPJ and STS. (E) Sagittal section shows preSMA/DACC. (F) Sagittal section shows posterior hippocampus/parahippocampus. All clusters survive whole brain correction using cluster correction, Z > 2.3, p < 0.05 and are displayed on the group average T1 image using the radiological convention (left = right).

