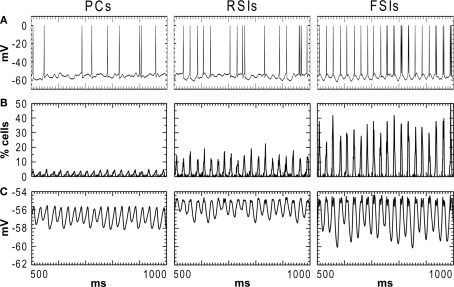
Figure 2.
Activity of each cell population in the baseline condition during the 500–1000 ms analysis window. (A) Individual cell membrane potentials with spikes superimposed. (B) Population spiking activity for each cell type, in % of cells per population (bin width = 1 ms). (C) Membrane potential averaged across each cell population.

