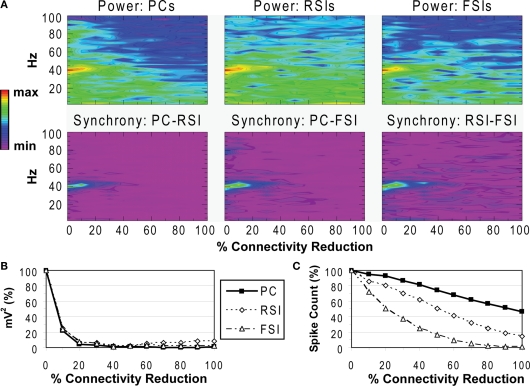
Figure 3.
Recurrent excitatory connectivity experiment. Measures are given as a function of % connectivity reduction. (A) Power and phase synchrony spectra in the γ oscillation simulation. Power (mV2, log10 transformed) is scaled between the minimum and maximum for each plot. Phase synchrony is scaled from 0 to 1. (B) Change in peak oscillation power (mV2) expressed as percentage of baseline. (C) Excitability of each cell population measured as the mean spike count, expressed as percentage of baseline.

