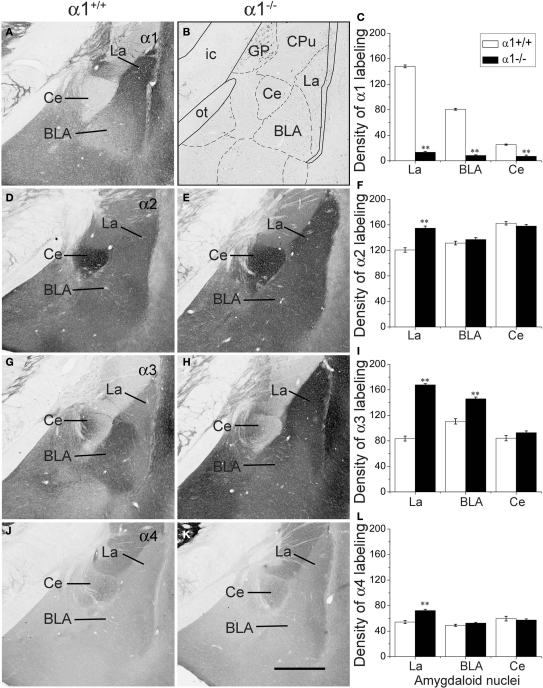
Figure 1.
Comparison of labeling for the α1 (A–C), α2 (D–F), α3 (G–I) and α4 (J–L) subunits in three amygdaloid nuclei in coronal sections of control and α1−/− mice. (A) In a control mouse, α1 labeling is high in the lateral amygdaloid nucleus (La) but relatively low in the basolateral nucleus (BLA). Virtually no labeling is evident in the central nucleus (Ce). (B) In a α1−/− mouse, no specific α1 labeling is present in the amygdaloid complex although a few cell bodies are labeled in the globus pallidus. A superimposed schematic drawing identifies the location of the amygdaloid nuclei and nearby structures, including the globus pallidus (GP), caudate putamen (CPu), optic tract (ot) and internal capsule (ic). (D) In a control mouse, moderate α2 subunit labeling is present in the lateral and basolateral nuclei, and strong α2 labeling is evident in the central nucleus. (E) In α1−/− mice, α2 subunit labeling is increased in the lateral nucleus, but no changes are evident in the basolateral and central nuclei. (G) In a control mouse, low levels of α3 subunit labeling are present in the lateral and central nuclei, but moderate α3 labeling is evident in the basolateral nucleus. (H) In a α1−/− mouse, α3 subunit labeling is substantially increased in the lateral nucleus and moderately increased in the basolateral nucleus. (J) In a control mouse, α4 subunit labeling is low in the three amygdaloid nuclei. (K) In a α1−/−mouse, α4 subunit labeling is slightly increased in the lateral nucleus, but remains low in this region, as in the other amygdaloid nuclei. (C, F, I, L) Bar graphs illustrate the virtual absence of α1 labeling in the α1−/− mouse (C), and a significant increase in α2, α3 and α4 labeling (F, I, L) in the lateral nucleus in α1−/− mice. The only other significant change is an increase in α3 labeling in the basolateral nucleus. Error bars represent SEM. **p < 0.01. Scale bar, 500 μm for all panels.

