Figure 2.
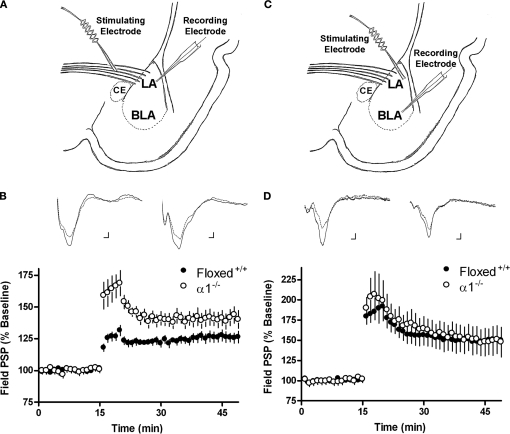
(A) Schematic describing the electrode placement for experiments involving the thalamo-LA pathway. (B) The amount of lateral amygdala activity-dependent plasticity induced by 100 Hz stimulation of the thalamo-LA pathway in slices from floxed+/+ controls (black circles) and α1−/− (white circles) mice. Inset shows sample extracellular traces elicited during baseline (smaller response) and 25–30 min after 100 Hz stimulation in slices from floxed+/+ controls (left side of panel) and α1−/− mice (right side of panel). Calibration bars: 1 ms, 0.1 mV. (C) Schematic describing the electrode placement for experiments involving the LA-BLA pathway. (D) The amount of basolateral amygdala activity-dependent plasticity induced by 100 Hz stimulation of the LA-BLA pathway in slices from floxed+/+ (black circles) and α1−/− (white circles) mice. Inset shows sample extracellular traces elicited during baseline (smaller response) and 25–30 min after 100 Hz stimulation in slices from floxed+/+ (left side of panel) and α1−/− mice (right side of panel). Calibration bars: 1 ms, 0.1 mV.

