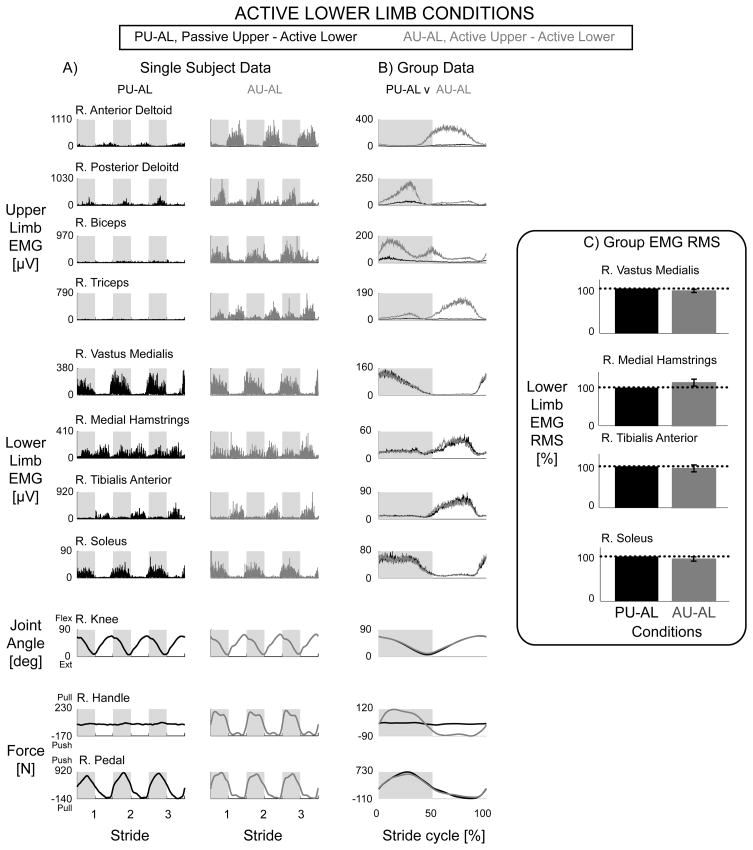
Figure 4.
Data from the right limbs for active lower limb conditions, Passive Upper & Active Lower (black) and Active Upper & Active Lower (grey). Representative single subject data (A) and group EMG mean profiles (B) showed no observable differences in active lower limb muscle activity during Passive Upper & Active Lower and Active Upper & Active Lower conditions. Group EMG RMS amplitudes with standard error bars (C) were not significantly different between Passive Upper & Active Lower and Active Upper & Active Lower (rmANOVA P > 0.05). Dotted line equals 100%. Note different y-axes between A and B. The knee joint angle profiles and active lower limb forces were similar between the two conditions (Fig. 4A & 4B). There were large increases in lower limb pushing force during the lower limb extending phase of the stride cycle. The handle forces were minimal during the Passive Upper & Active Lower condition and had increases in pulling and pushing forces during the Active Upper & Active Lower condition (Fig. 4A & 4B).

