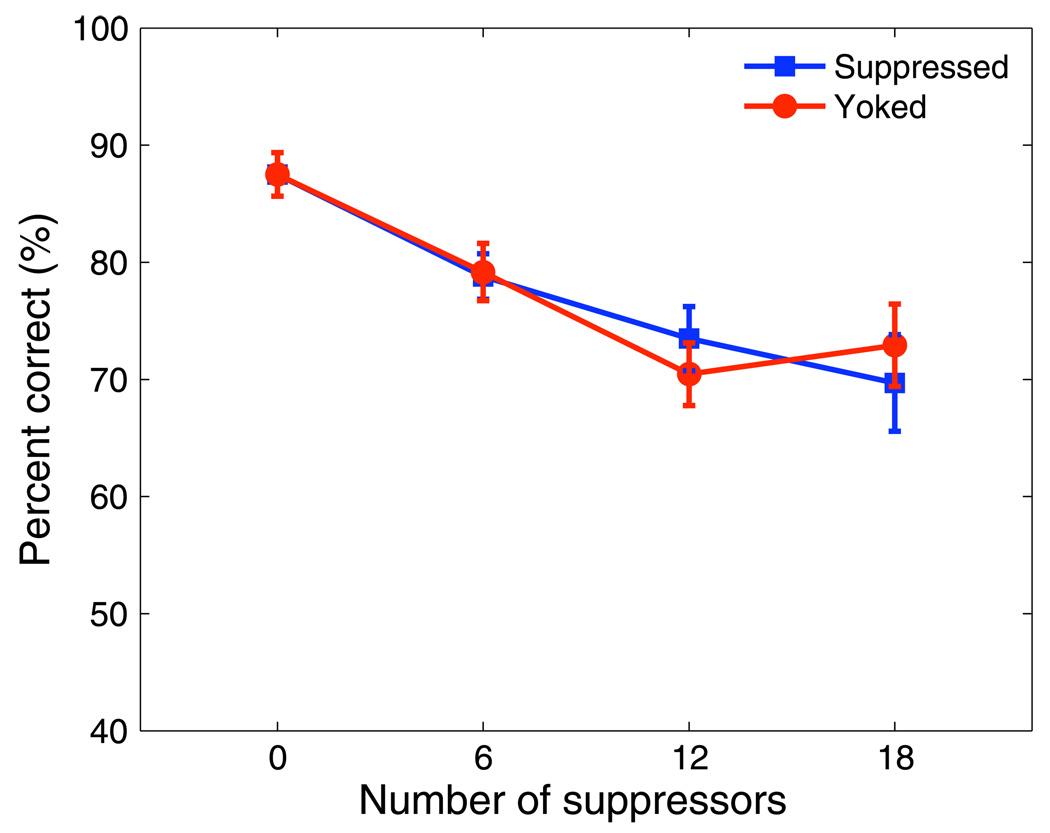
Figure 4.
The results of Experiment 1. Percent correct for suppressed (squares) and yoked (circles) conditions. The error bars are standard errors of the mean (SEMs). Note that the mean size difference used in this main experiment (15%) is larger than the mean size (7%) used for the control experiment summarized in Figure 3.

