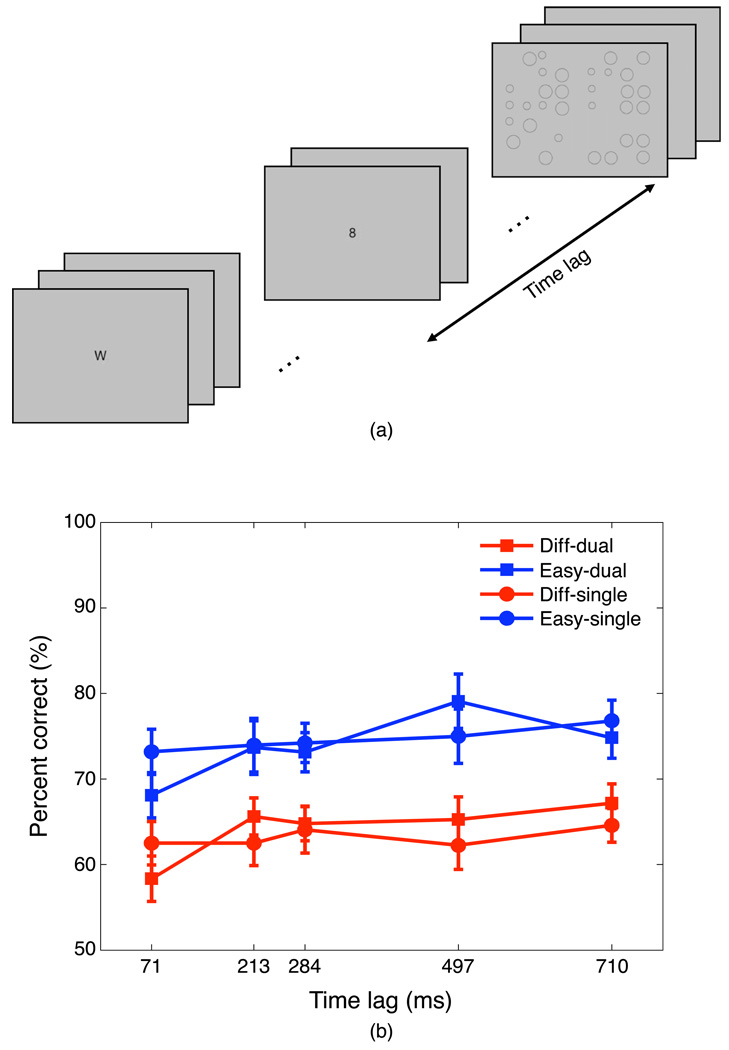
Figure 5.
(a) The timeline of Experiment 2-1. Time lag was defined by the time difference between T1 (digit) and T2 (circle arrays). Stimulus onset asynchrony (SOA) was 71 ms. (b) the percent correct of T2 given correct report of T1. Both T1 and T2 were reported in the dual task whereas only T2 was reported in the single task. The mean size difference was 8% for the difficult condition and 13% for the easy condition. The error bars are SEMs.

