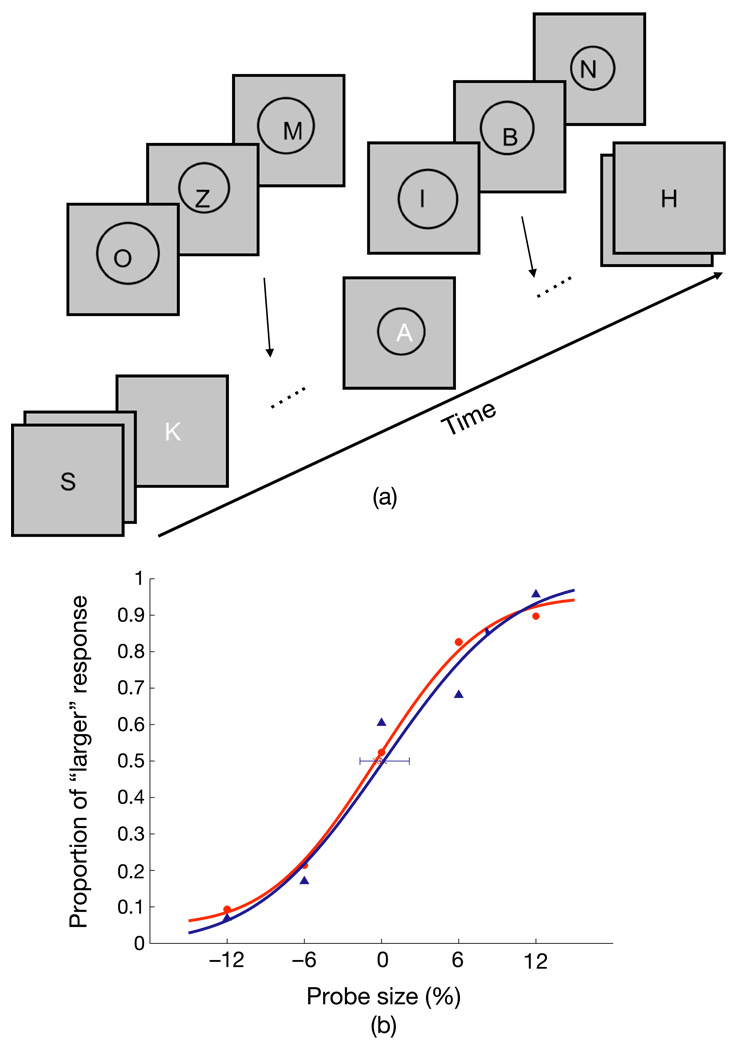
Figure 6.
(a) Timeline of Experiment 2-2. Observers reported the identity of white letters as well as the mean size of the circles. Seven circles for mean size computation were presented around T2 position. (b) Results of an observer. X-axis is the probe size and y-axis is the proportion of larger response for each probe size. Red and blue dots are responses for the AB and the NoAB conditions, respectively. Red and blue curve depicts the observer’s psychometric function for the AB and the NoAB conditions, respectively. The error bars are the 95% confidence intervals.

