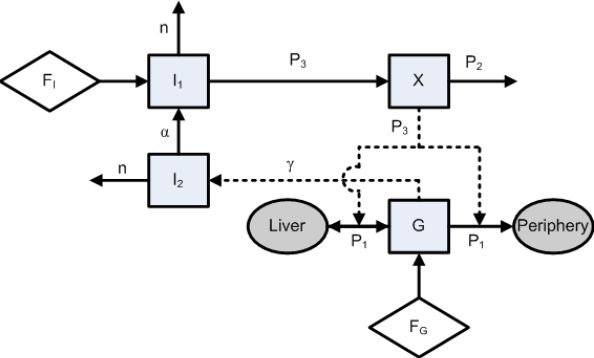
Figure 1.

Representation of the ICU-MM. The state variables of the model (G, X, I1, and I2) and the body segments (liver and periphery) are denoted as squares and ellipses, respectively. The exogenous input variables (FI and FG, administered intravenously to the patient) are illustrated as rhombi. The model parameters (P1, P2, P3, n, α, and γ) are related to the respective variables. A direct physical relation is represented by a solid arrow, whereas a rather mathematical relationship is denoted as a dashed arrow.
