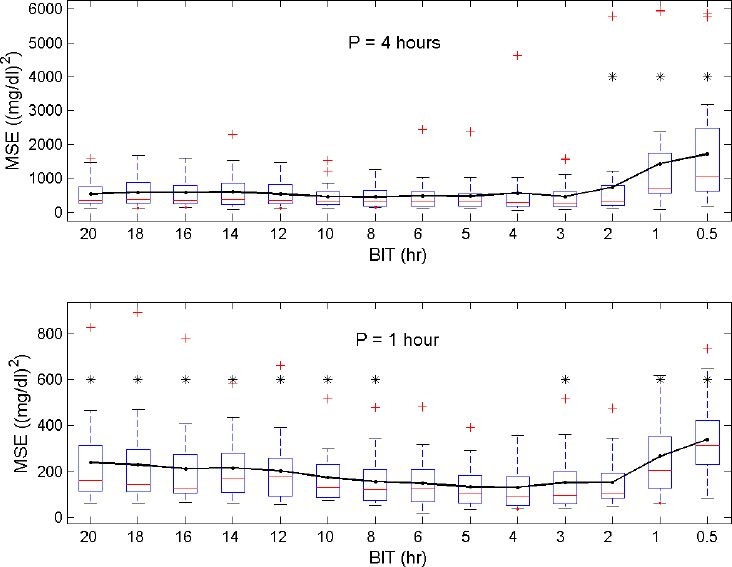
Figure 2.

Distribution of the MSEs (generated for each patient) as a function of BIT with reestimations every 4 hours (top) or every hour (bottom). The line connects the averages of the MSEs. In general, reestimations based on the last 4-hour data set (BIT = 4) result in the smallest prediction errors. Significant differences with respect to the BIT = 4 setting are visualized with an asterisk.
