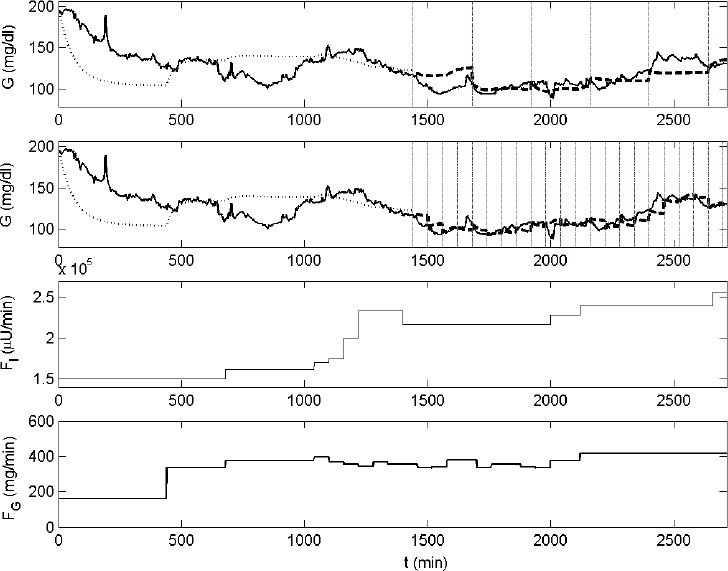
Figure 4.

Example of the reestimation strategy applied to the ICU-MM. The evolution of glycemia of patient No. 3, measured with the GlucoDay system, is presented in the first and second panels (solid line). Data of the first 24 hours are used to estimate the initial ICU-MM. The in-sample simulation is represented by the dotted line. Glycemia predictions present in the other part of the data are illustrated with the dashed line for both the 4-hour (top panel) and the 1-hour (second panel) reestimation process. Reestimation time instants are illustrated by vertical lines. The flows of insulin and carbohydrate calories are shown in the third and fourth panels, respectively.
