
Figure 8.
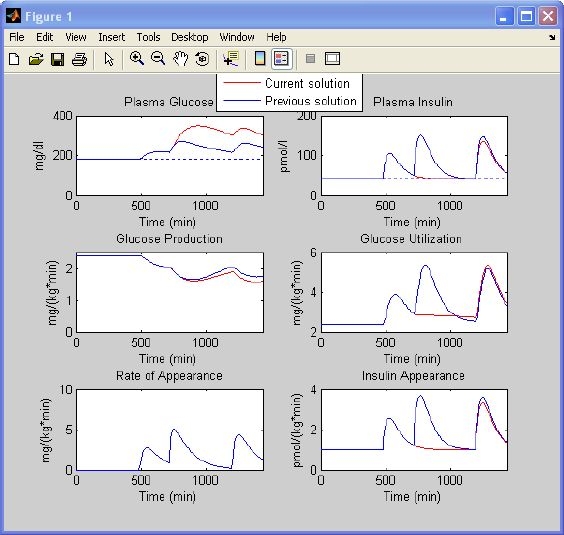
Simulation results of a type 1 diabetic subject controlled in an open loop. Glucose and insulin concentrations, glucose production, glucose utilization, meal rate of appearance, and insulin appearance obtained with settings of Figure 6 (left) (blue line) are superimposed on those obtained in the same subject who forgot to inject insulin before lunch (red line).