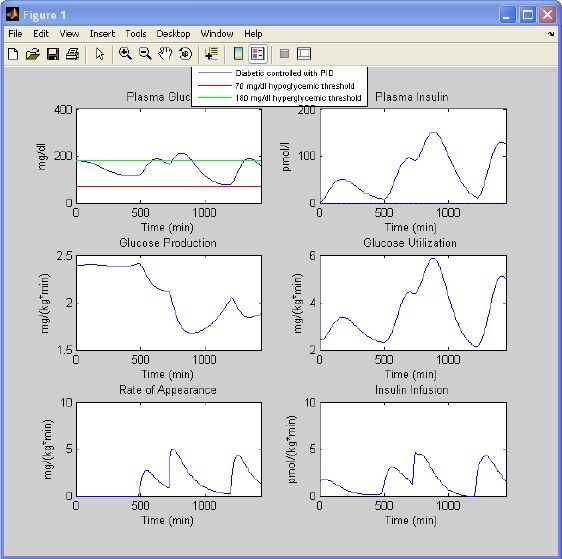
Figure 9.

Simulation results of a type 1 diabetic subject controlled in a closed loop with a PID controller. Glucose and insulin concentrations, glucose production, glucose utilization, meal rate of appearance, and insulin infusion are obtained with settings of Figure 6 (right). Hypoglycemia (red) and hyperglycemia (green line) thresholds are also displayed.
