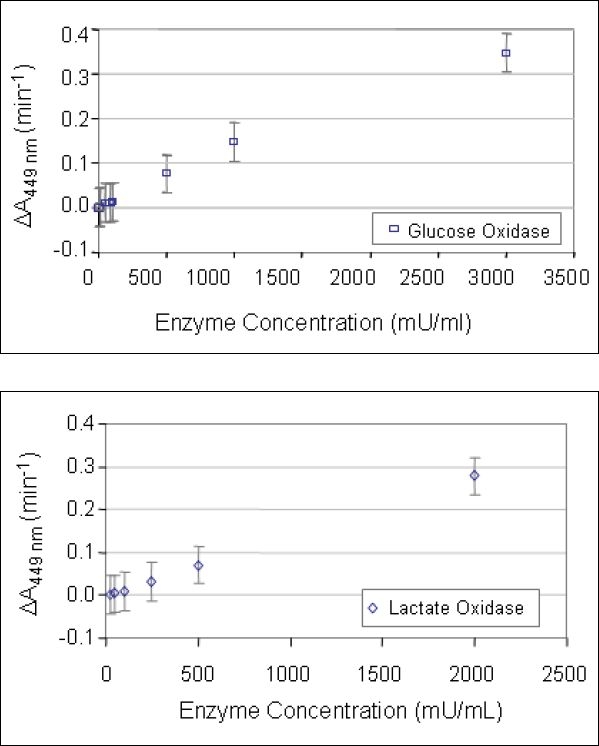
Figure 1.

Standard curves for the relationship between the rates of change in the 449 nm absorption peak from o-dianisidine oxidation as a function of enzyme concentration (glucose oxidase - open squares, lactate oxidase - open diamonds). Standard error bars are shown. The curves for glucose oxidase and lactate oxidase are essentially superimposable upon one another.
