
Figure 4.
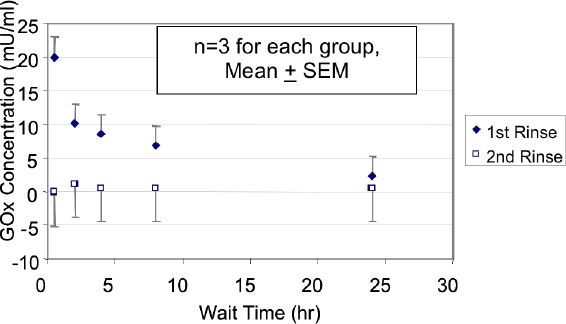
Glucose oxidase concentration (mU/ml, using the Amplex Red assay) as a function of the wait duration (hour). The first rinse is shown with diamonds and the second rinse with squares. During the first rinse, the wait duration markedly reduced the glucose oxidase concentration. All of the rinse solutions had a 1 ml volume. For the first rinse, each of the 4 data sets beyond the first one was significantly lower (P < 0.02) than the first set. For the second rinse, each of the 5 data sets was significantly lower (P < 0.001) than the first data set for the first rinse.