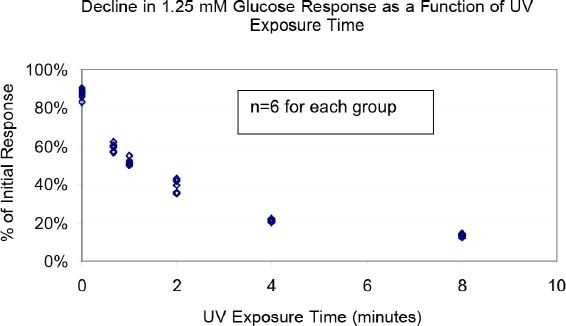
Figure 5.

Use of UV exposure as a model of graded enzyme destruction:Electrochemical Measurement – Note decline in the response to 1.25 mM glucose of sensors coated only with enzyme (no permselective membrane) as a function of UV-exposure time (minutes). At each of 6 times, 6 different sensors were tested, and each data point from each time is displayed. Each of the 5 data sets beyond the first data set was significantly lower (P < 0.001) than the first data set.
