
Figure 7.
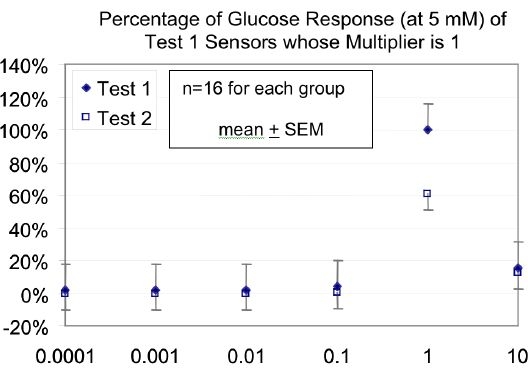
Graph showing the normalized 5 mM glucose responses of new sensors (Test 1 – solid diamonds) and the same sensors one year later (Test 2 – open squares) built with a range of glutaraldehyde concentrations. Standard error bars are shown. The sensors built with the highest concentration of glutaraldehyde show the smallest decline in sensitivity after one year. For the multiplier of 1, there was a significantly lower response (P < 0.001) for Test 2 (one year later) than for Test 1. For both Test 1 and Test 2, data from all multipliers other than 1 had significantly lower response (P < 0.001) than the corresponding data with a multiplier of 1.