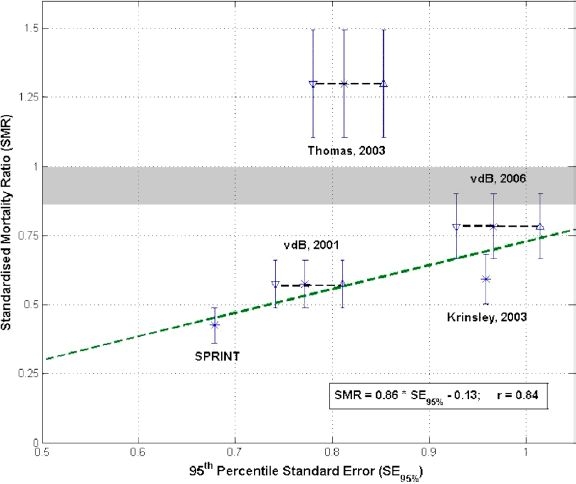
Figure 1.

Standardised mortality ratio (SMR) versus tightness of control represented as SE95%. All values are based on published results2,14,17,20,59 where vdb stands for van den Berghe et al and Thomas for Thomas et al. The line is fit excluding the outlying data from Thomas et al. The vertical error bars show 15% potential variation in reporting or determining average APACHE II scores.62 The average glucose variation due to not including all measurements is estimated at 5% and additional error bars are generated for van den Berghe et al and Thomas et al at these values with their center points connected by a dashed line, thus accounting for potential variation in the average glucose or glucose variation determined.
