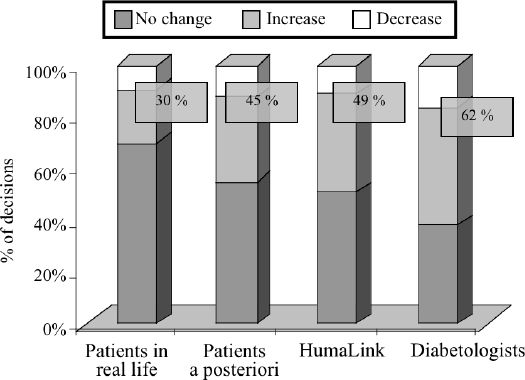
Figure 2.

Distribution of the decisions made by the 14 patients in real-life, the 14 patients a posteriori, HumaLink and the 6 diabetologists, as a no-change, an increase or a decrease of the insulin doses. All paired comparisons are highly significant (p<0.00001). Data are presented as means. Numbers inside the boxes refer to the percentages of change.
