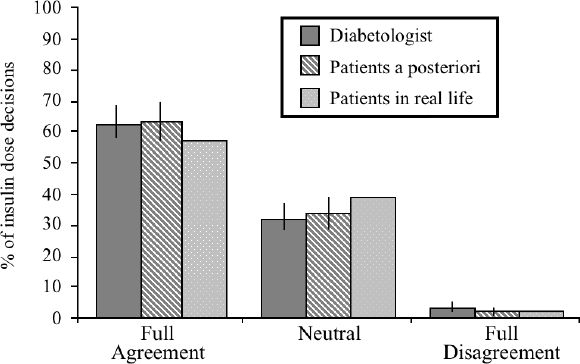
Figure 3.

Categorization of the percentages of insulin dose decisions into full agreement, neutral, full disagreement, according to the Decision Analysis Grid. Data are presented as mean and SD. For the comparison between the decisions made by HumaLink on one hand, and the diabetologists or the patients a posteriori on the other hand, the SD bar represents the variability of the data observed when considering the 6 diabetologists or the 14 patients, respectively. For the comparison between HumaLink® and the patients in real-life, we present the percentages, among the 1690 decisions, of full agreement, full disagreement, or neutral comparisons, explaining the absence of SD bar.
