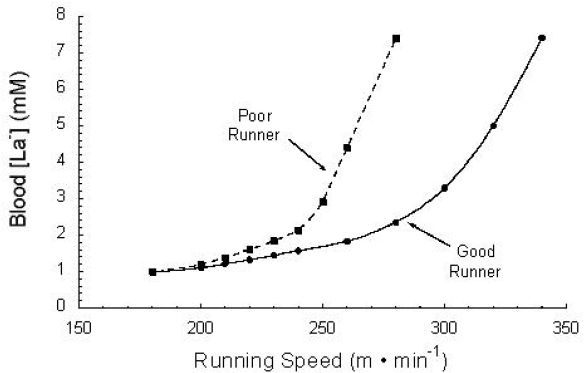
Figure 9.

Schematic showing differences between a “good runner” and a “poor runner” in terms of the [La−]b response to progressive incremental exercise. Used (redrawn) with permission from Kumagai S, Tanaka K, Matsuura Y, Matsuzaka A, Hirakoba K, Asano K. Relationships of the anaerobic threshold with the 5 km, 10 km, and 10 mile races. Eur J Appl Physiol. 1982;49(1):13-23 (Figure 3).
