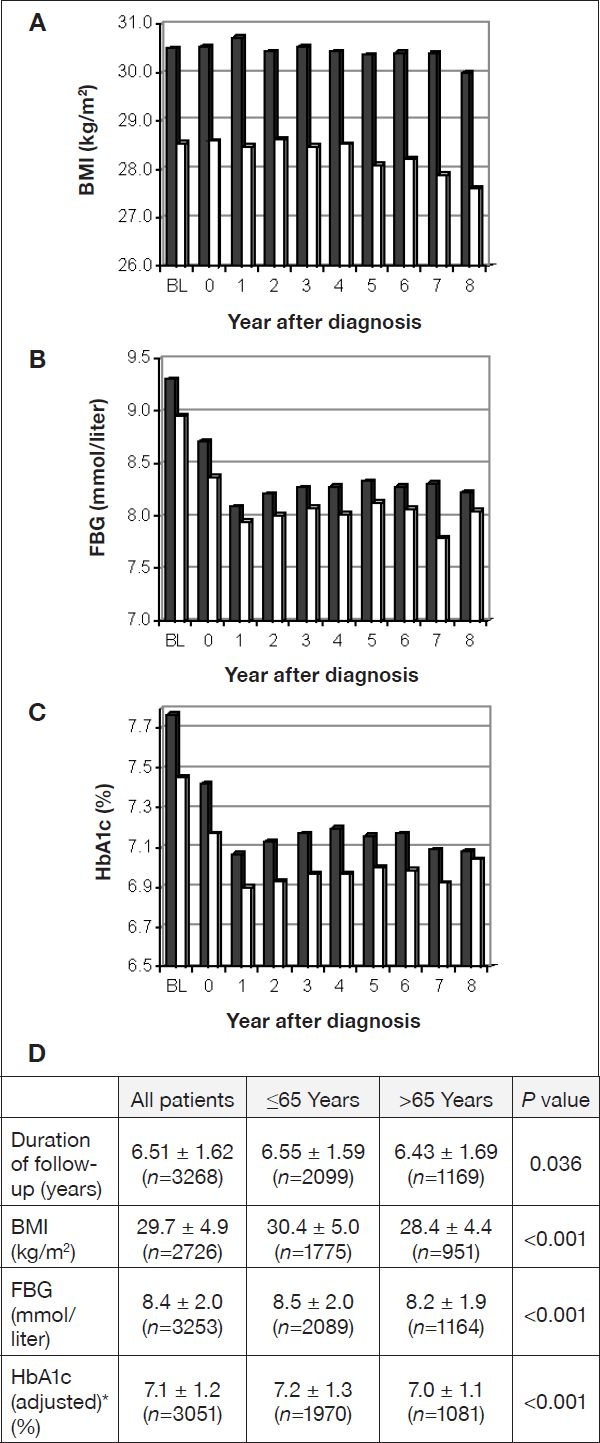
Figure 1.

Follow-up values per year after diagnosis for BMI (A), FBG (B), and HbA1c (C). Black bars, age group ≤65 years; white bars, age group >65 years; BL, baseline. (D) Mean values ± SD for the duration of follow-up and for BMI, FBG, and HbA1c averaged over follow-up. *HbA1c was adjusted as in Table 1.
