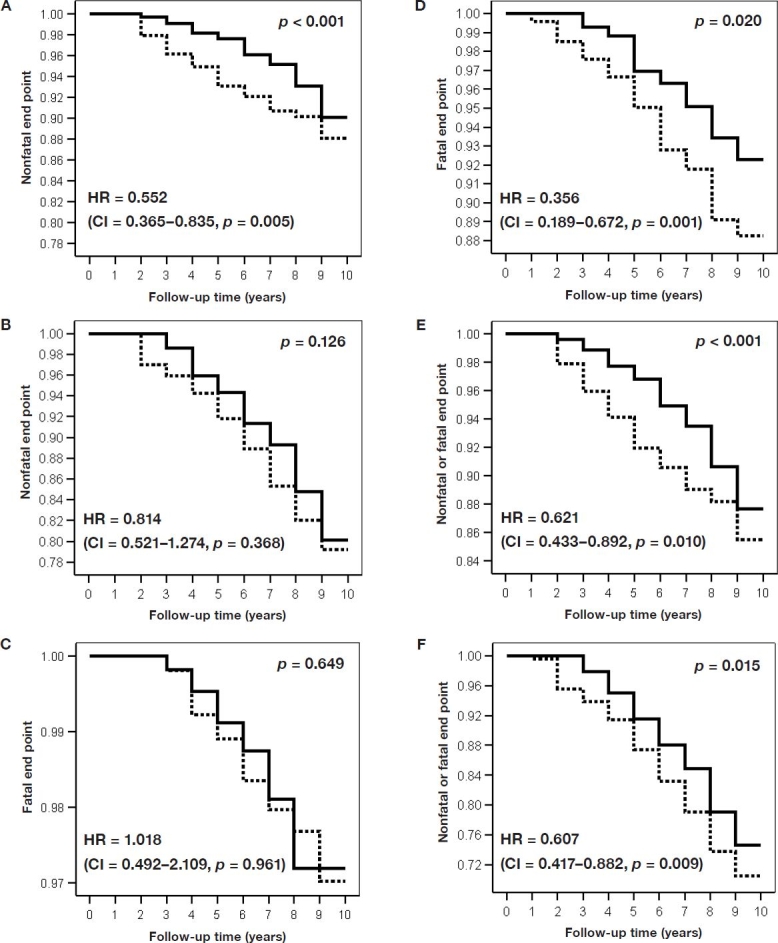
Figure 2.

Decremental life tables for the age group ≤65 years (A, C, E) and for the age group >65 years (B, D, F). The y axis indicates the proportion of patients without a nonfatal end point (A, B), without a fatal end point (C, D), or without a fatal or a nonfatal end point (E, F). Subdivision of the follow-up time is 1 year after diagnosis. Solid line, patients performing SMBG; dotted line, patients not performing SMBG. The indicated Wilcoxon p values relate to the difference between patients performing SMBG and patients not performing SMBG. HR indicates the adjusted hazard ratios (as described in the text) calculated with Cox proportional hazards modeling (CI = 95% confidence interval of HR, p = test significance).
