
Figure 6.
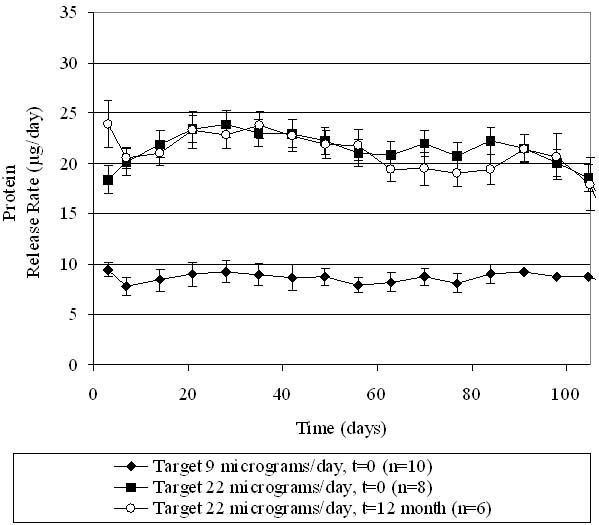
In vitro release rate of omega IFN, with protein loadings in the device corresponding to two different target drug delivery rates. The “t = 0” group was tested shortly after manufacturing, and the “t = 12 month” group was stored at 5°C for 1 year before testing. Data points represent averages, and error bars represent 1 standard deviation of data.