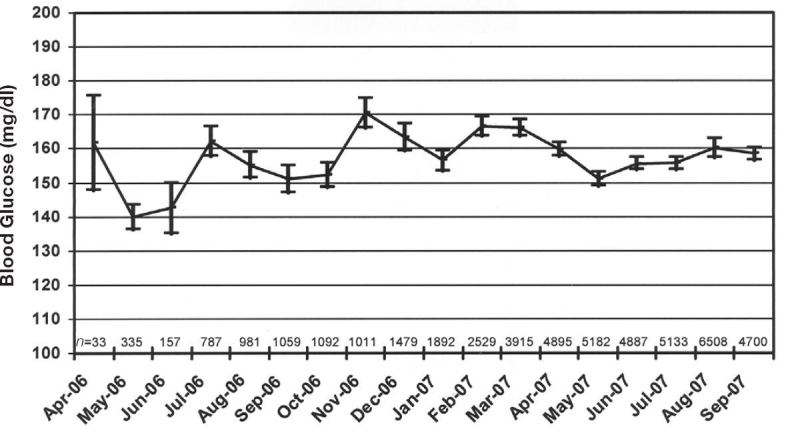
Figure 3.

Mean blood glucose by month, for all measurements taken with the CGS-SQ at Methodist and University Hospitals from April 2006 to September 2007. Bars represent 95% confidence intervals of the mean; n is the number of CGS-SQ measurements per month.
