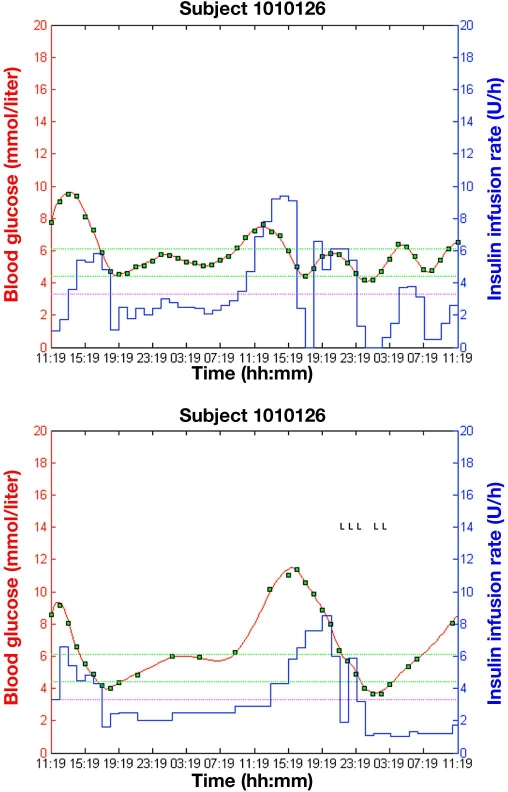
Figure 3.
Graphical output from simulation studies with synthetic subject 1010126 using two versions of the control algorithm: MPC Version 0.1.5 with a regular hourly sampling interval (top) and MPC Version 1.4.3 with a variable sampling interval (bottom); green squares represent glucose measurements, the blue line (piecewise constant) represents the insulin infusion rate, and the red solid line represents simulated blood glucose. Green dashed lines represent the target glucose range (4.4–6.1 mmol/liter; 80–110 mg/dl), and the magenta dashed line represents the level of mild hypoglycemia (3.3 mmol/liter; 60 mg/dl). Letters L seen in the background on the right are used as diagnostic symbols.

