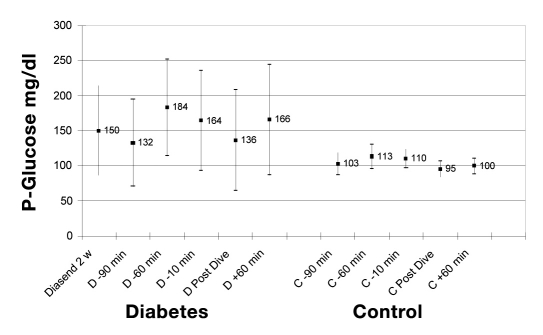
Figure 2.
Distribution of glucose levels (SMBG measured 14 days prior to dive and PG measured in a monitoring schedule). Values expressed as mean and standard deviation for all five dives aggregated and shown in the study groups: type 1 diabetes and control. Time (min) in relation to dive. There was a significant difference between the groups each test time: p < .005.

