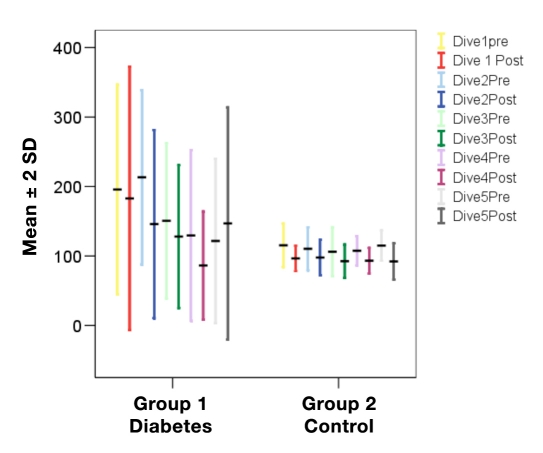
Figure 3.
Distribution of glucose levels (PG), mean and standard deviation, in the study groups: type 1 diabetes and control. Values represented are as follows: 10 min predive and immediately postdive with all 5 dives in consecutive order. There was a significant difference between the groups: Dives 1–3 and 5, p < .05, and Dive 4, p < .001.

