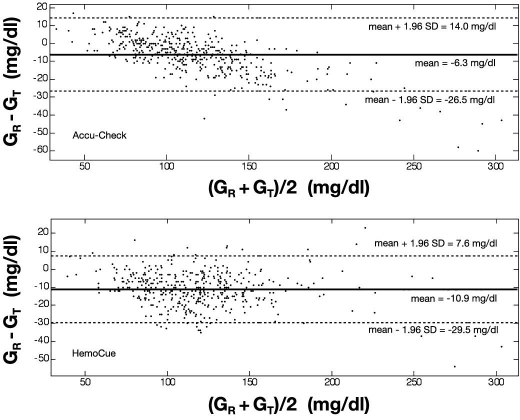
Figure 2.
Bland–Altman analysis. The bias (or mean difference) and the limits of agreement (±1.96 standard deviation) are shown for both glucometers in the entire range of measured BG. The bias for the Accu-Chek® is –6.3 mg/dl; the limits of agreement are +14.0 and –26.5 mg/dl (top). The bias for the HemoCue® is –10.9 mg/dl; the limits of agreement are +7.6 and –29.5 mg/dl (bottom). Again, the reference (ABL) and the test sensor devices (Accu-Check/HemoCue) are symbolized by GR and GT, respectively.

