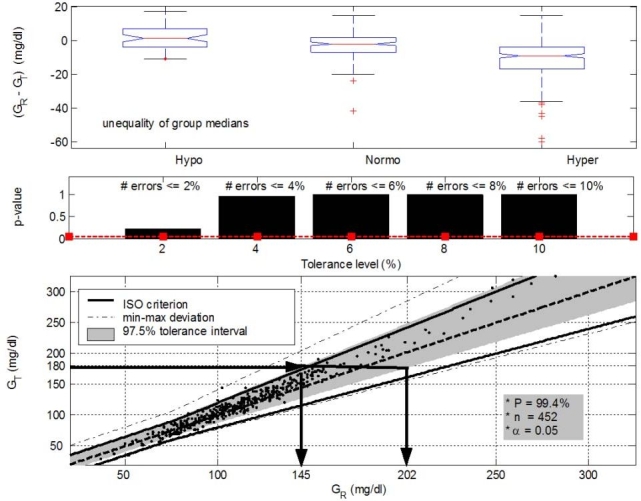
Figure 3.

GLYCENSIT analysis for the Accu-Chek® sensor. (Top, phase 1) Nonpersistent measurement behavior (p = 0 < 0.05) shown by the presence of both overestimated and underestimated measurement deviations. Median measurement errors for the hypo-, normo-, and hyperglycemic range are 1.5, –2, and –9 mg/dl, respectively. (Middle, phase 2) Few errors against the ISO criterion are observed (p ≥ 0.05 for all selected tolerance levels). The significance level (5%) is represented by the dashed line. (Bottom, phase 3) The 97.5% tolerance intervals (shaded area) mean that 95 new measurements obtained from the test sensor out of 100 (significance level is 5%) lie in this area with a probability of 99.4%. The size of these intervals determines possible future sensor deviations. Let us take an example (illustrated with the arrows). When 180 mg/dl is measured with the test sensor (GT) (i.e., a new observation), the real (reference) glycemia value (GR) will lie between 145 and 202 mg/dl in 95% of the cases. The probability level (P) that the reference observation effectively lies in this area is equal to 99.4%. The solid and dashed line illustrate the ISO criterion limits and the GT = GR axis, respectively. Dashed–dotted lines denote the minimum and maximum deviation present in data (given by points).
