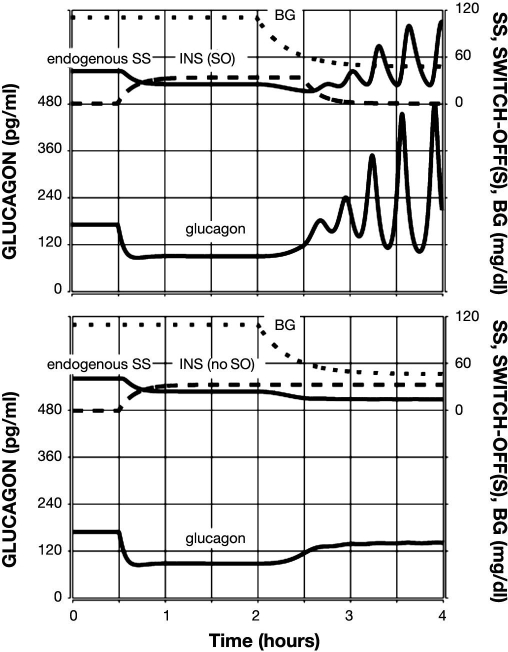
Figure 4.
Model-predicted GCR response to glucose decline and an intrapancreatic infusion of SS that has been switched off (top) or not switched off (bottom) during hypoglycemia. Glucagon is shown by the lower black line; endogenous SS is shown by the upper black line; exogenous SS infusion is shown by a dashed line; and BG is shown by a sparsely dotted line.

