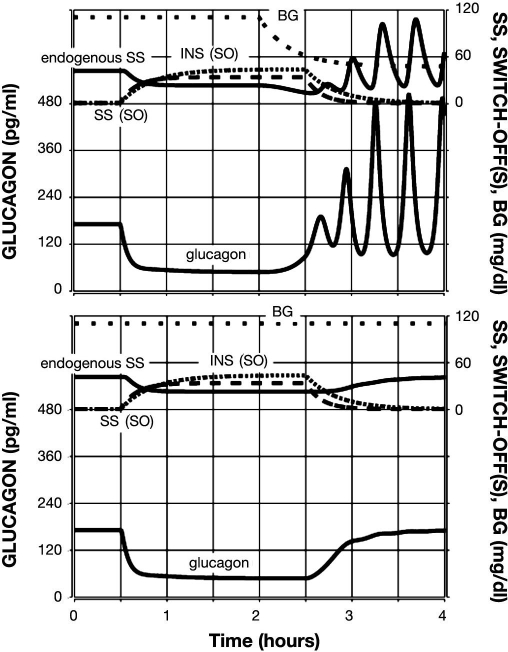
Figure 5.
Model-predicted GCR response to glucose decline (top) or lack of decline (bottom) and a combined INS and SS SO. Glucagon is shown by the lower black line; endogenous SS is shown by the upper black line; INS infusion is represented by a densely dotted line; exogenous SS infusion is shown by a dashed line; and BG is shown by a sparsely dotted line.

