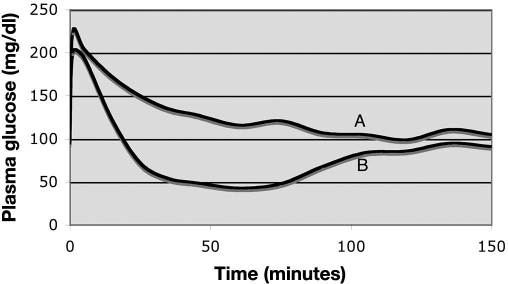
Figure 7.
Graph depicting the response of the plasma glucose concentration to administration of an IV bolus of glucose and an IV injection of insulin (combined insulin glucose test; details provided in the text). The graph depicts the response of two different animals. Insulin sensitivity is generally assessed as satisfactory for those individuals in which the plasma glucose concentration returns to its baseline value within 45 minutes of the outset of the protocol. In this case, horse A had poor insulin sensitivity and horse B had normal insulin sensitivity.

