
Figure 2.
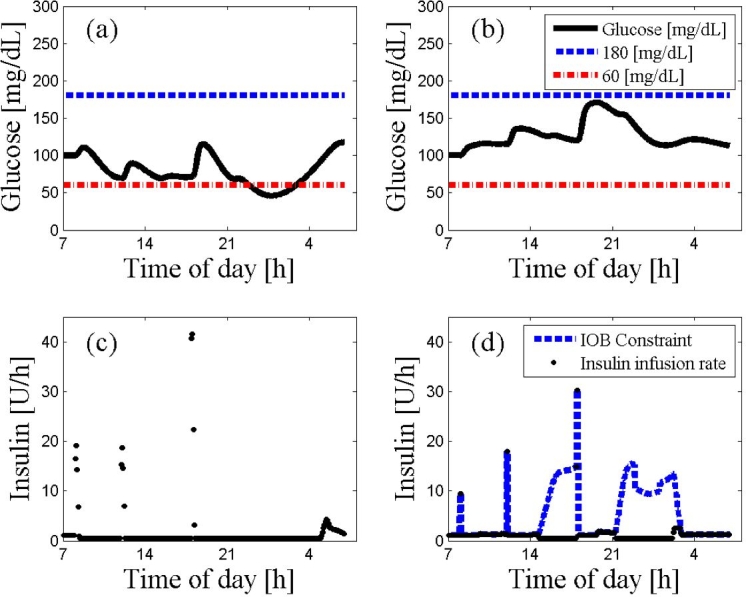
An ARX-based MPC on subject 2 with and without the IOB constraint. The 24 h scenario starts at 7:00 AM at steady state followed by a protocol of three meals (8:00 AM, noon, and 6:00 PM) with 20, 40, 70 g of CHO, respectively. The MPC used a prediction horizon of 400 time steps, a control horizon of 5 time steps, and a weighting of unity for both insulin delivery rates and glucose tracking error. Panel (A) describes glycemic trajectories (continuous line) with a fixed hard constraint that exhibits risky behavior by crossing the hypoglycemic threshold. The precarious results are prevented by the controller incorporating the IOB constraint as presented in panel (B). Moreover, the MPC with the IOB constraint keeps glycemia, marked by a continuous curve, above 100 mg/dl without any risk of hypoglycemia. The IOB constraint on the rate of insulin administration is described by the dashed curve in panel (D), while the implemented insulin rate of the control moves is represented by circles in both panels (C) and (D). Panel (D) shows that the rate of the injected insulin is frequently constrained by the empirical values of the CF and I:C to prevent potential hypoglycemia.