
Figure 3.
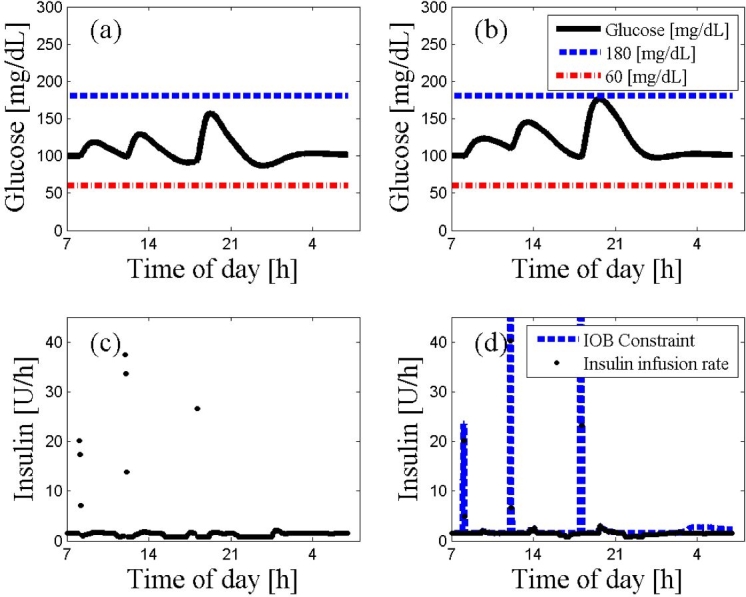
An ARX-based MPC on subject 10 with and without the IOB constraint. The 24 h scenario starts at 7:00 AM at steady state followed by a protocol of three meals (8:00 AM, noon, and 6:00 PM) with 20, 40, 70 g of CHO, respectively. The glucose trajectories with and without the IOB constraint are presented in panels (A) and (B), respectively. The controller moves with or without the IOB constraint are presented in panels (C) and (D), respectively. The dashed lines represent the values of hyperglycemia and hypoglycemia. The controller that incorporated the IOB constraint shows a more conservative behavior in panel (D) than the controller that was missing the IOB constraint in panel (C).