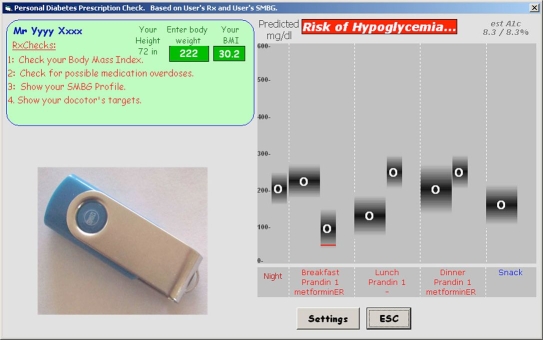
Figure 2.
GUI screen image illustrating the predicted glycemic profile on the right. (From left to right) Eight profile points illustrate, respectively, overnight, pre- and postbreakfast, pre- and postlunch, pre- and postdinner, and prebedtime measurement time points. Premeal medications are shown in the spaces spanning the breakfast, lunch, and dinner meal periods. There is no medication at bedtime (snack) in this case. A listing of the first four prescription checks completed thus far is shown on the upper left under the heading RxChecks. Estimated A1C is 8.3% as shown in the upper right corner. A sample device is also shown.

