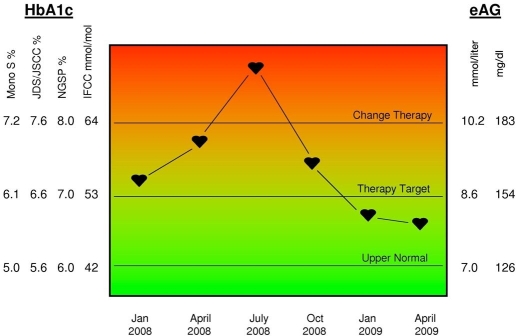
Figure 1.
Multilingual patient chart. The monitoring of HbA1c of a virtual patient at six points in time from January 2008 until April 2009 is shown, expressed in all HbA1c units on the left-hand y axis and eAG units on the right-hand y axis, with indication of the upper normal level, therapy target, and level for change therapy. JSCC, Japan Society of Clinical Chemistry.

