
Figure 2.
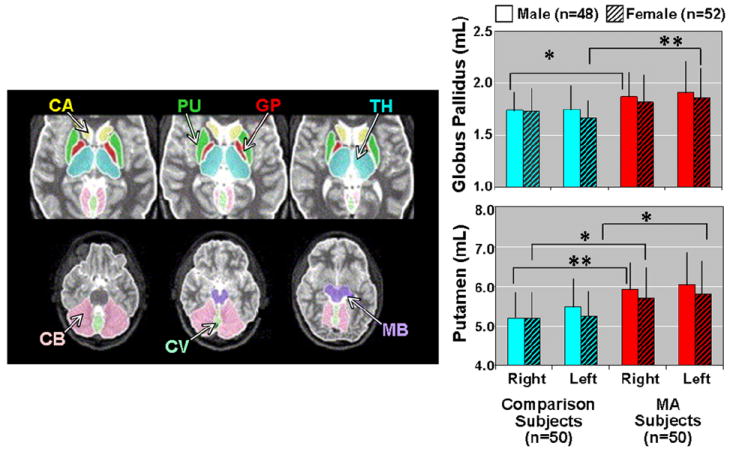
Left: Axial MRI slices showing measured brain regions. CA - caudate, PU - putamen, GP - globus pallidus, TH - thalamus, CB - cerebellum, CV - cerebellar vermis, MB - midbrain. Right: Bar graphs showing larger volumes of lentiform nuclei (putamen and globus pallidus) in methamphetamine (MA) abusers compared to healthy volunteers. Putamen MA effects: right – F1,96 = 11.74, p = .0009; left – F1,96 = 12.55, p = .0006. Globus Pallidus MA effects: right – F1,96 = 6.22, p = .01; left – F1,96 = 10.32, p = .002. *= p<.05; **= p<.005; MRI, magnetic resonance imaging 63.