Fig. 5.
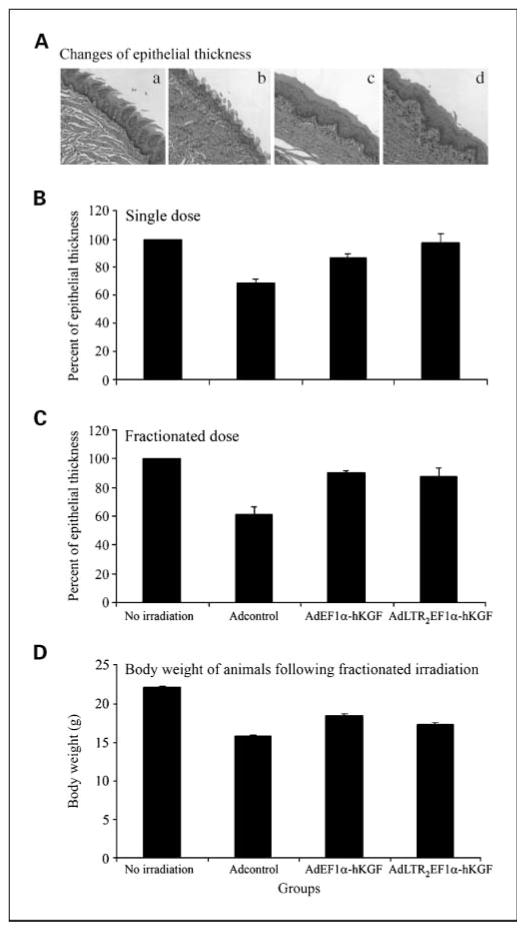
Determination of epithelial thickness on mouse tongues and body weight after irradiation. A, representative histologic sections from each study group: a, no irradiation control with normal stratified squamous epithelium and integrity of papillae; b, Adcontrol plus irradiation showing loss of epithelial integrity resulting in ulceration covered by a pseudo membrane, along with the presence of inflammatory cells in the adjacent connective tissue; c, AdEF1a-hKGF plus irradiation showing preserved stratified squamous epithelium with an absence of papillae; d, AdLTR2EF1α-hKGF plus irradiation showing preserved stratified squamous epithelium with an absence of papillae. B, epithelial thickness in single-dose irradiation experiments. Data shown here are from all three experiments. C, epithelial thickness in fractionated irradiation experiments. Data shown here were from both experiments done. D, body weight of animals after fractionated irradiation. In Band C, the epithelial thickness of the no irradiation group was set as100%. All other values were calculated relative to this no irradiation control group. Columns, mean values; bars, SE. For the single irradiation dose studies (B), a Kruskal-Wallis one way ANOVA on ranks was significant (H = 12.85, P =0.005). Multiple pairwise comparisons (Tukey test) of the groups indicated that the no irradiation group and the AdLTR2EF1α-hKGF groups were significantly different from the Adcontrol plus irradiation group (P < 0.05). For the fractionated irradiation dose studies(C), the Kruskal-Wallis one-way ANOVA was significant (H = 9.6, P = 0.022). The subsequent multiple pairwise comparison showed that the only significant difference was between the no irradiation and Adcontrol plus irradiation groups (P < 0.05). For the body weight determinations (D), the data shown are mean values ± SE. A one-way ANOVA of the data was significant: F = 33.8 and P < 0.001. A multiple pairwise comparison (Tukey test) showed that the no irradiation group was significantly different from all other groups (P < 0.001). Additionally, both hKGF vector groups were significantly different from the Adcontrol group (P ≤ 0.006), whereas the hKGF vector groups were not significantly different from each other.

