
Figure 2.
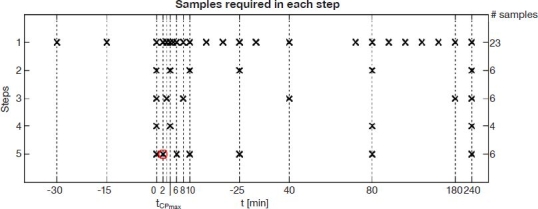
Sample optimization steps 1–5 and samples used for calculations in each step. Real samples are marked as ×, and the introduced “correction” sample in step 5 is marked with a circle.
Official websites use .gov
A
.gov website belongs to an official
government organization in the United States.
Secure .gov websites use HTTPS
A lock (
) or https:// means you've safely
connected to the .gov website. Share sensitive
information only on official, secure websites.
Sample optimization steps 1–5 and samples used for calculations in each step. Real samples are marked as ×, and the introduced “correction” sample in step 5 is marked with a circle.