
Figure 3.
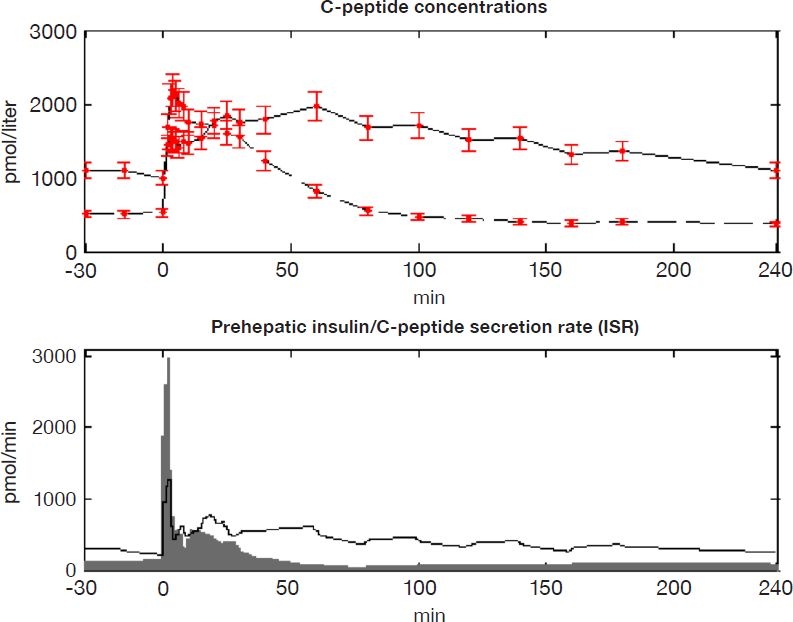
(Top) Mean C-peptide concentration in NGT (dashed) and T2DM (solid) subjects. Samples from Mari18 are shown with error bars of ± 2σ. (Bottom) Mean estimated C-peptide secretion rate (ISR) in NGT (gray area) and T2DM (solid line) subjects.
Official websites use .gov
A
.gov website belongs to an official
government organization in the United States.
Secure .gov websites use HTTPS
A lock (
) or https:// means you've safely
connected to the .gov website. Share sensitive
information only on official, secure websites.
(Top) Mean C-peptide concentration in NGT (dashed) and T2DM (solid) subjects. Samples from Mari18 are shown with error bars of ± 2σ. (Bottom) Mean estimated C-peptide secretion rate (ISR) in NGT (gray area) and T2DM (solid line) subjects.