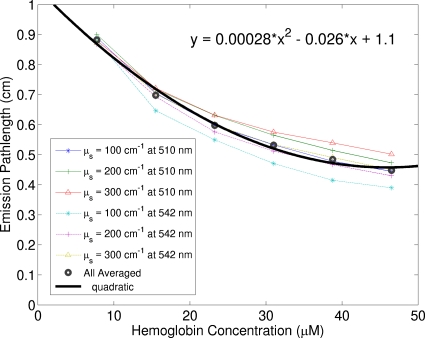
Figure 4.
Simulated average emission path length of fluorescence photons as a function of oxyhemoglobin concentration for various scattering coefficients. The two emission wavelengths used in the simulations, 510 and 542 nm, are the local minimum and maximum of oxyhemoglobin absorption spectrum. The absorption coefficients of deoxyhemoglobin for the wavelength range in this paper lie between the minimum and the maximum absorption coefficients of oxy-hemoglobin used in the simulations.

