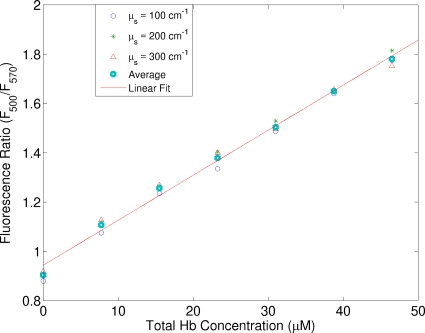
Figure 6.
Ratio of fluorescence at two emission wavelengths (RtHb=F500∕F570) as a function of the total hemoglobin concentration acquired from the first set of phantoms. The excitation wavelength was 414 nm. This figure can serve as the calibration curve for estimating the total hemoglobin concentration even hemoglobin oxygenation is different.

