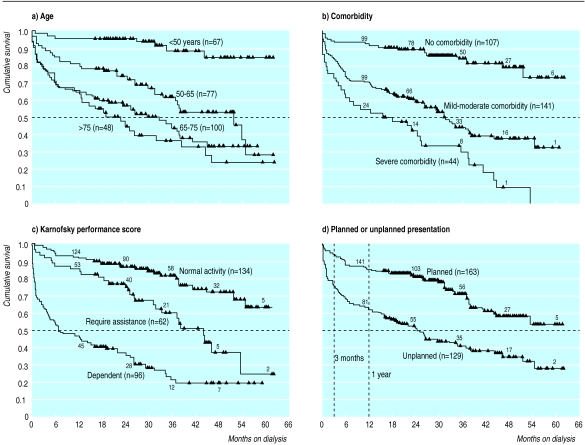
Figure 2.
Kaplan-Meier survival curves. Each step represents one death, and each triangle denotes survivor at latest follow up. Numbers on top of lines are patients remaining in analysis at each time point. (a) Effect of age on survival. (b) Effect of comorbidity (using comorbidity severity score: mild-moderate comorbidity, 1-4; severe comorbidity, 5-8. (c) Survival in three groups defined by Karnofsky performance scale. (d) Difference in survival between planned and unplanned presentations for dialysis

